Cite this lesson as: Deutsch, J. L. (2015). Variogram Calculation for Tabular Deposits. In J. L. Deutsch (Ed.), Geostatistics Lessons. Retrieved from http://geostatisticslessons.com/lessons/tabularvariograms
Variogram Calculation for Tabular Deposits
Jared Deutsch
University of Alberta
October 15, 2015
Learning Objectives
- Recognize challenges for experimental variogram calculation in tabular deposits
- Select experimental variogram tolerance parameters for tabular deposits including angle tolerances and bandwidths
- Check the resulting experimental variograms for reasonableness
Introduction
Tabular deposits pose unique challenges for experimental variogram calculation. The complex geometries of tabular deposits often require a coordinate transformation prior to calculation. Care must be taken with the definition of horizontal variogram tolerance parameters to limit the number of unreasonable associations across geologic units. These challenges are addressed in this lesson, which follows the lesson on variogram tolerance parameters (Deutsch, 2015).
Prerequisites
Coordinate Transformation
A coordinate transformation is almost always required for tabular deposits. Typically, a new coordinate system is defined after applying a rotation and translation to the original coordinates (Pyrcz & Deutsch, 2014). After rotation and translation, the perpendicular \(Z'\) coordinate of a stratigraphic layer may be transformed to a relative coordinates system \(Z'_{rel}\). The relative transform of a coordinate value \(z\) in \(Z'\) is defined by the correlation bottom \(z_{cb}\), correlation top \(z_{ct}\) and thickness of the stratigraphic unit, \(T\): \[ z_{rel} = \frac{z'-z_{cb}}{z_{ct}-z_{cb}} T \] In this new coordinate system, the rotated and translated \(X'\) and \(Y'\) coordinates correspond to the major and minor horizontal directions of the tabular formation. The relative \(Z_{rel}\) coordinate is 0 at the base of the tabular formation, and \(T\) at the top of the formation (Pyrcz & Deutsch, 2014). This combination of a rotation, translation and stratigraphic coordinate transform works well; however reverse faults and isoclines complicate the unfolding process and require additional care (Manchuk & Deutsch, 2015). In these cases a more sophisticated unfolding procedure is required.
Coordinate transformation is carried out prior to variogram calculation. Calculating an experimental variogram before coordinate transformation may substantially underestimate the extent of horizontal continuity.
Direction Selection
After coordinate transformation, the choice of orthogonal directions is typically well defined. The horizontal major and minor directions will be in the \(X'-Y'\) plane, and the vertical direction in the \(Z'\) direction. If the coordinate system has not been rotated to align with the principal axes, then dip and tilt rotations may be required when selecting variogram direction parameters for the horizontal variograms.
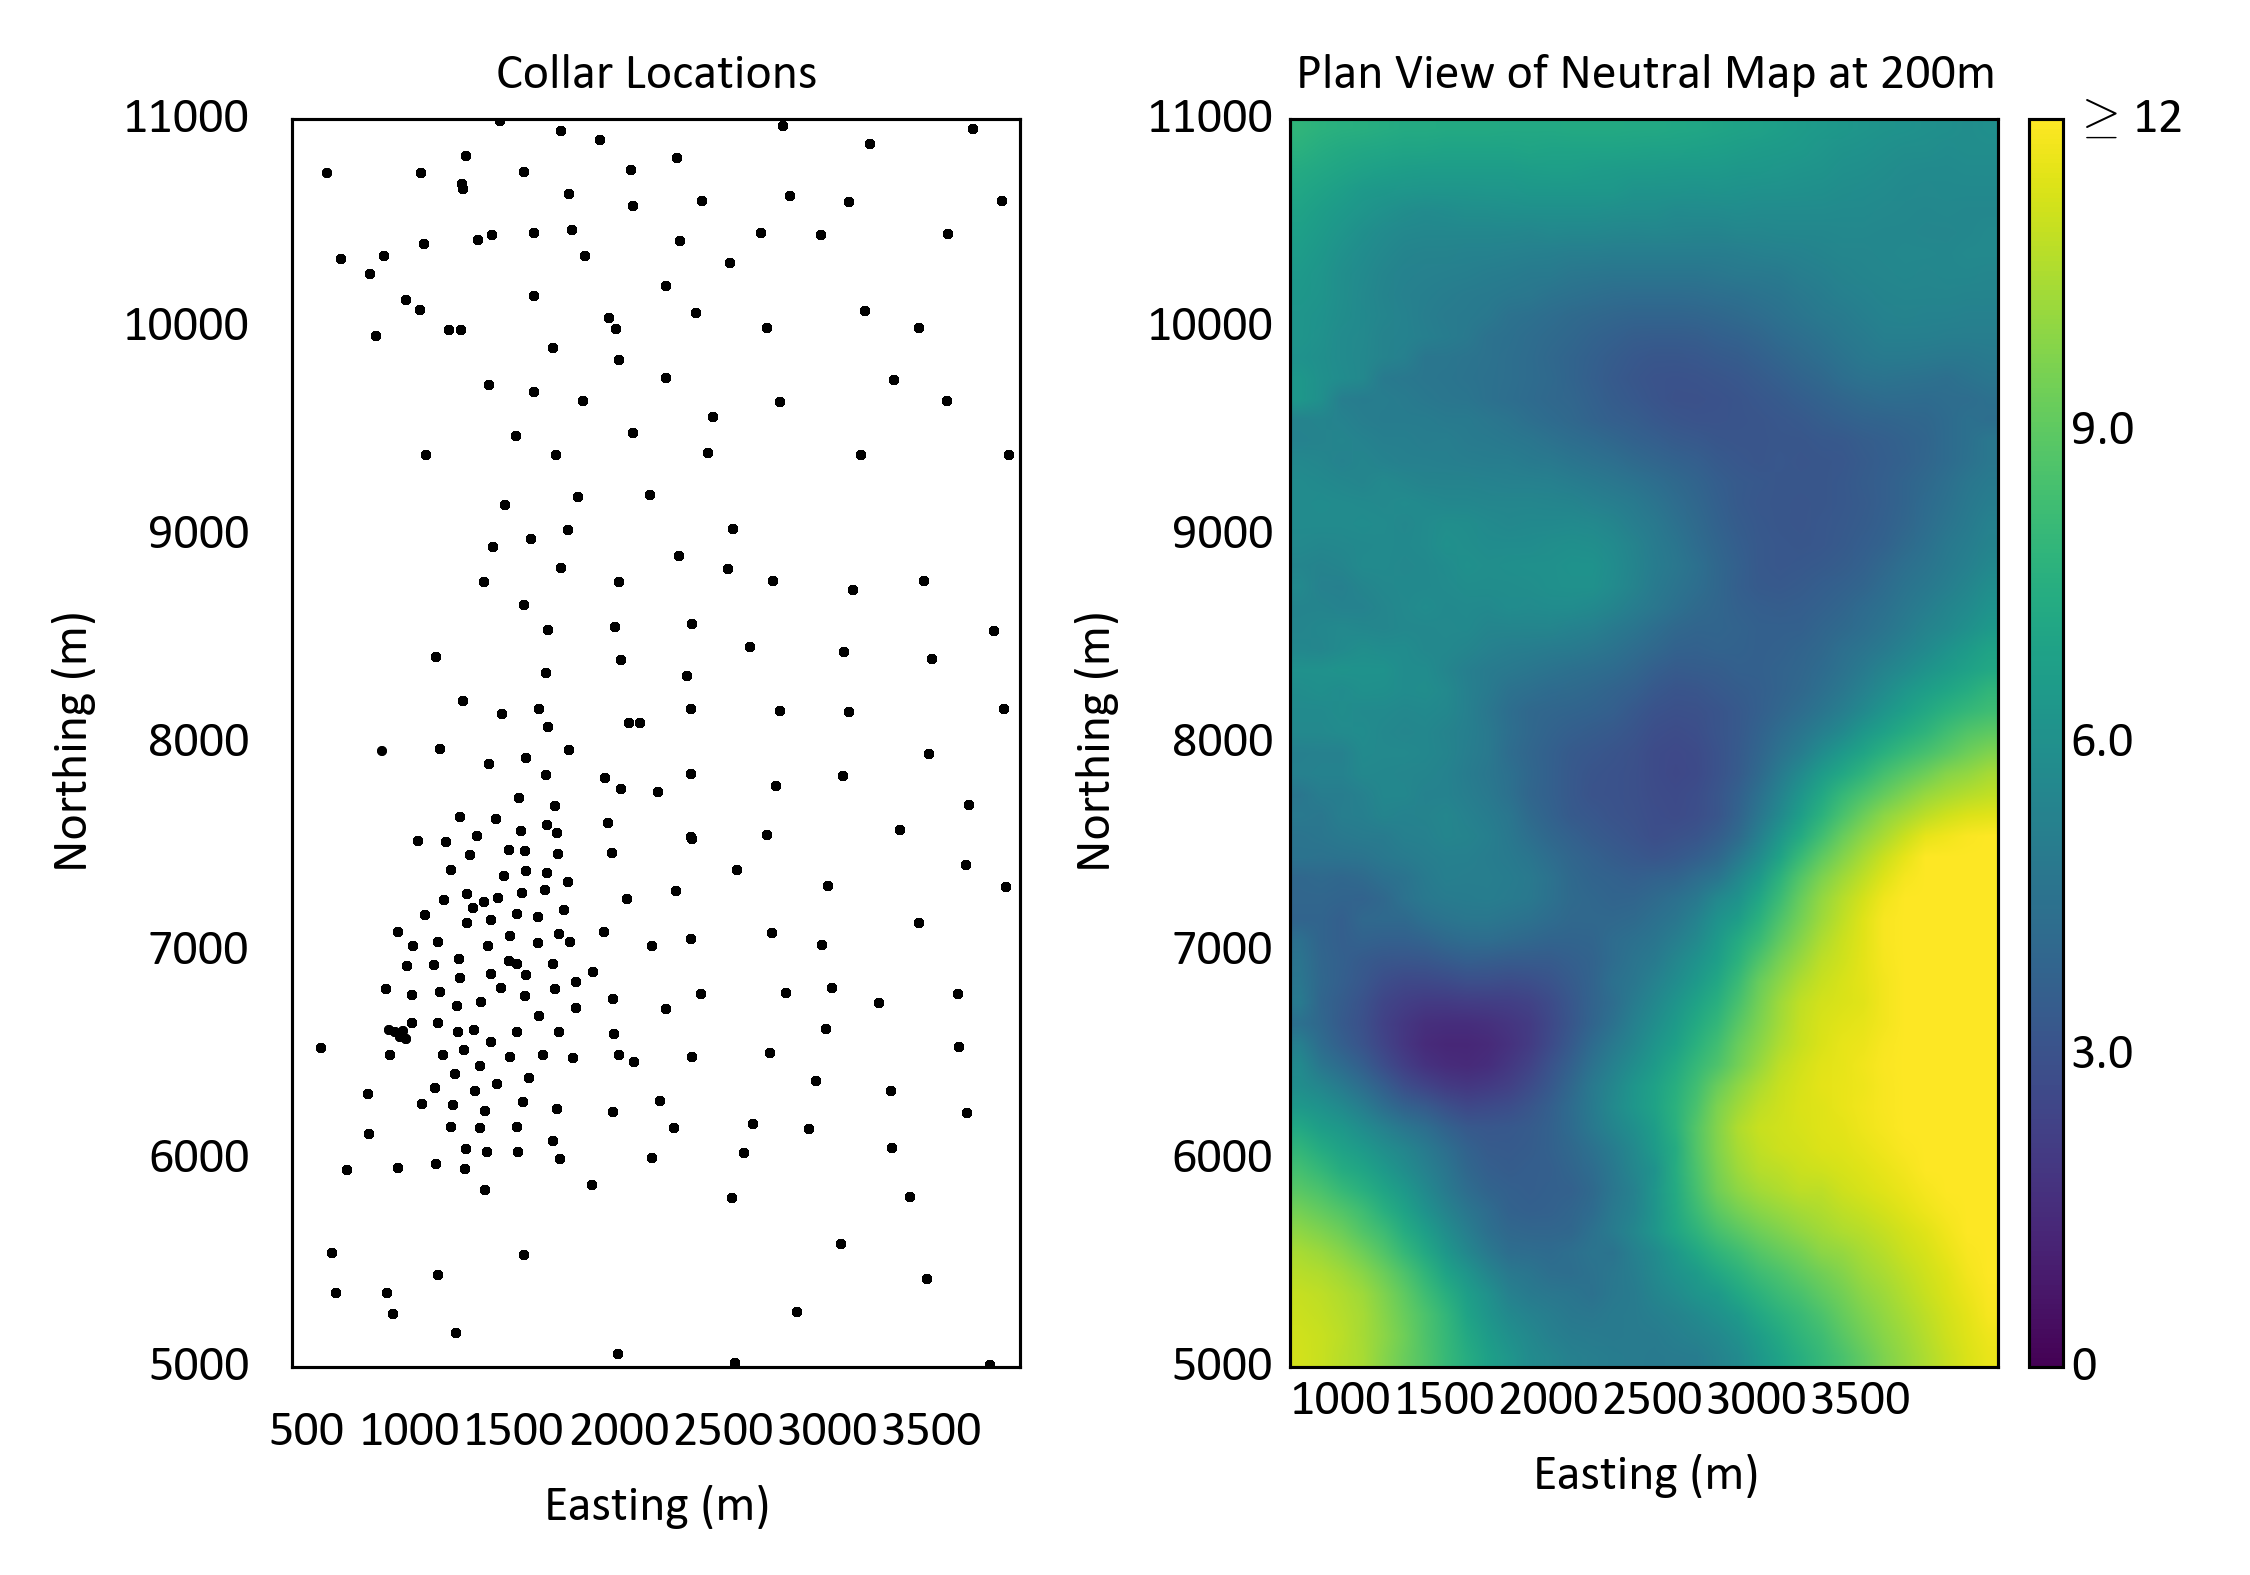
Consider an Athabasca oil sands deposit in Alberta for direction selection. The \(Z'\) coordinate is aligned with elevation for this specific deposit, so no coordinate transformation is required here. The principal direction of continuity is oriented to the North-East aligned with depositional dip. Consider the drilling data set for this deposit shown below. Drill holes are nominally 80 m long and composited to 3 m sample lengths. A neutral map of bitumen grades was constructed using ordinary kriging with a very large search and isotropic variogram model. A plan view through this neutral map at an elevation of 200 m is plotted. As expected from the regional geology, there is a high degree of continuity at an azimuth of 40-45 degrees. Choosing orthogonal directions with an azimuth of 40 degrees for the major, 130 degrees for the minor, and a dip of 90 degrees for the vertical is reasonable for this data set.

Vertical Variogram Parameter Selection
For a tabular deposit, the vertical variogram is calculated prior to the horizontal variogram as the range of spatial continuity in the vertical direction directly influences the selection of vertical tolerance parameters. Lag spacing and tolerances are dictated by the data spacing (Deutsch, 2015), but the selection of angle tolerances and bandwidths is still required for the vertical variogram. These are driven by the degree of drilling deviations. The angle tolerances and bandwidths are typically selected to avoid pairing samples from separate drill holes, but allow for minor deviations in drill holes.
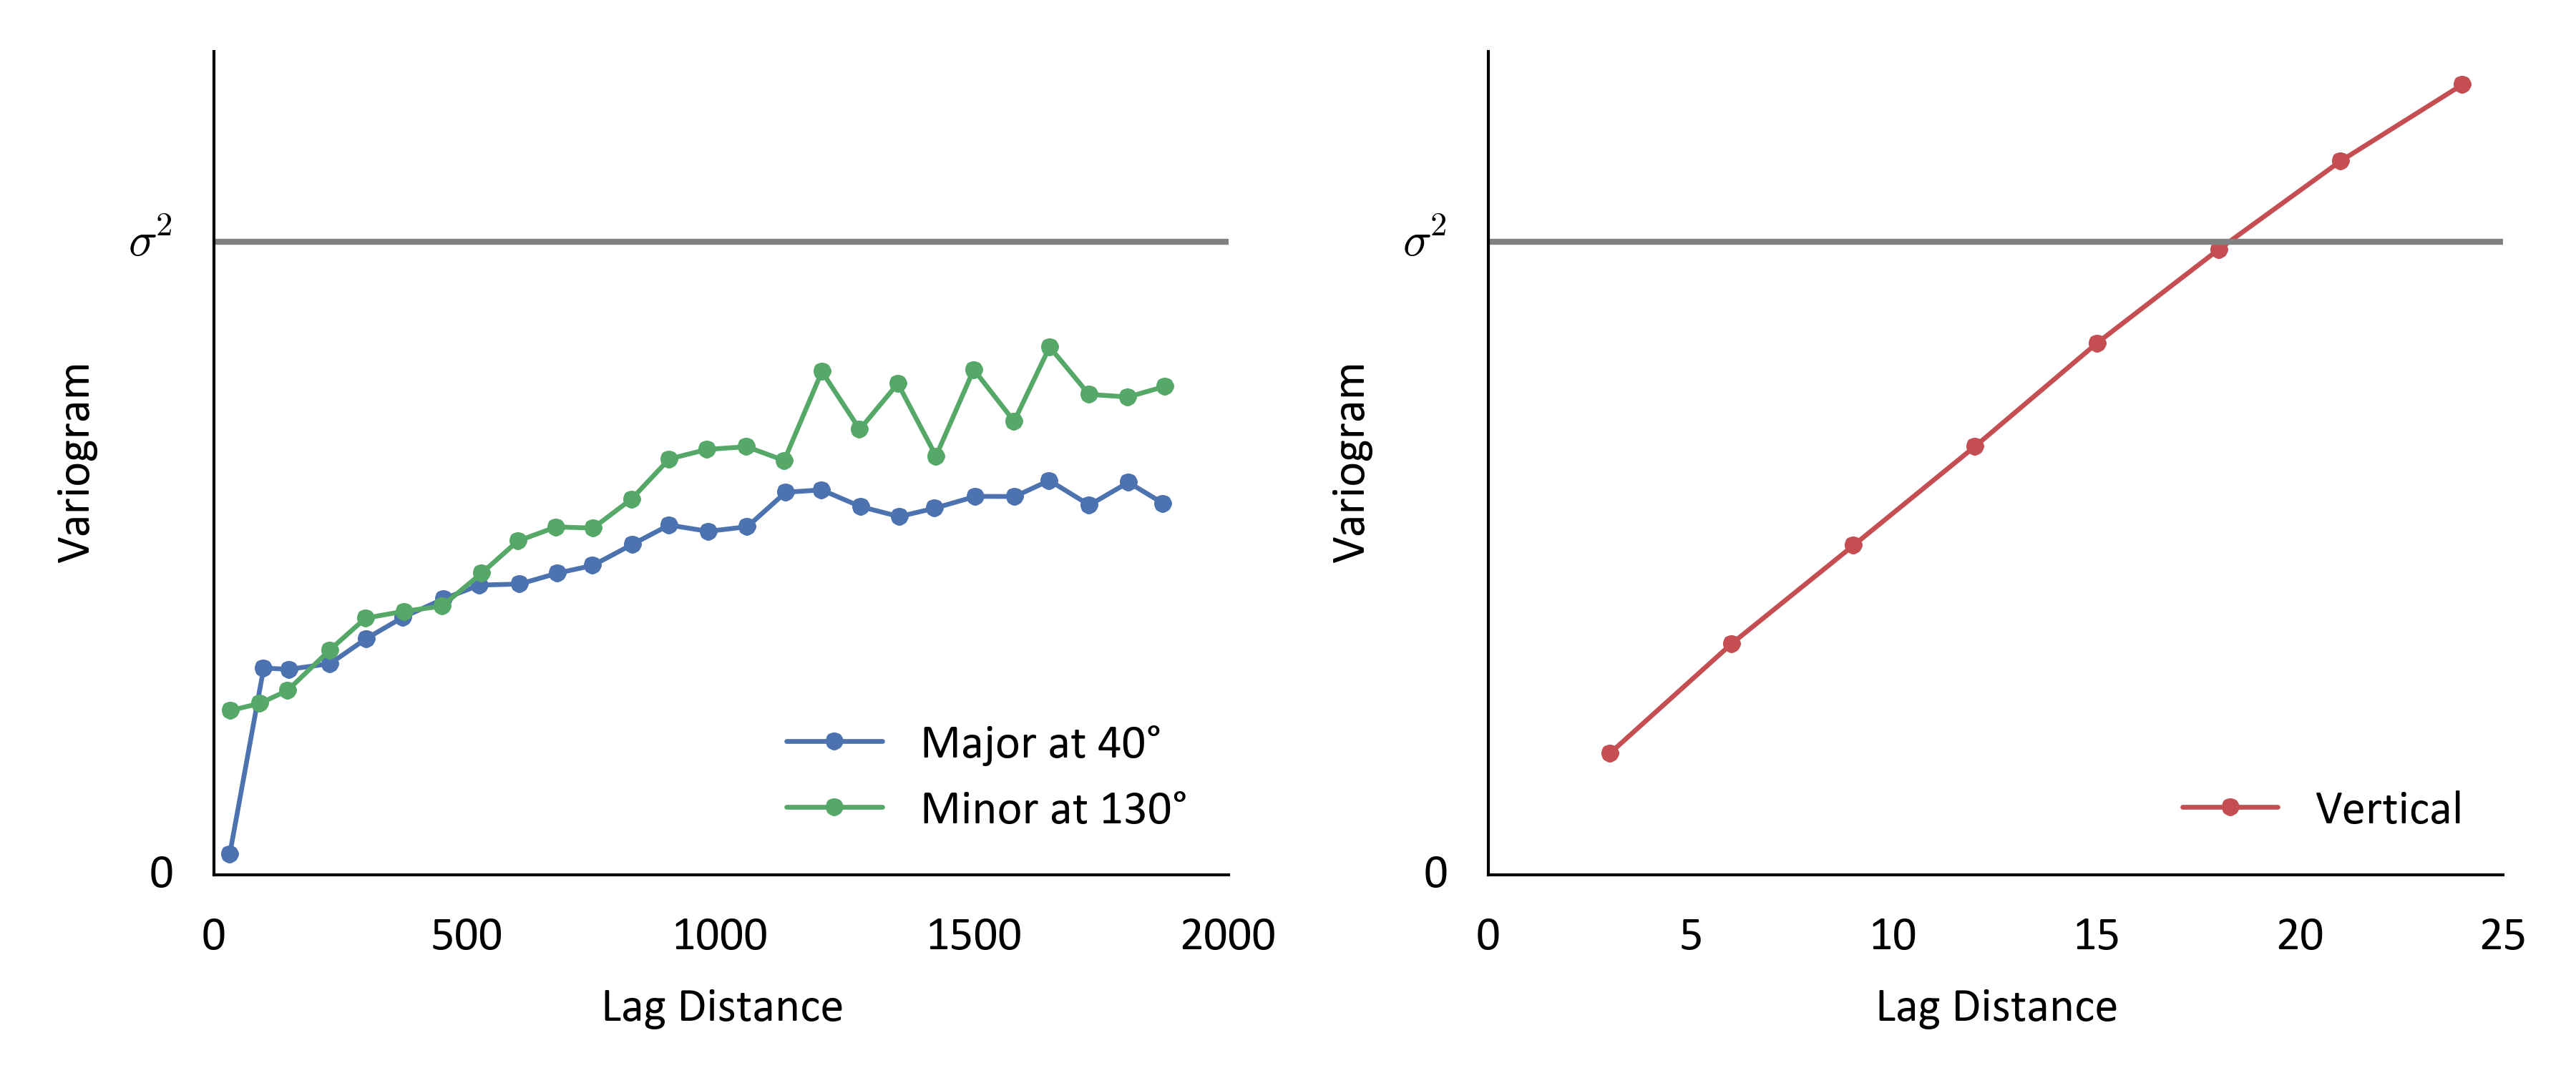
For the vertical variogram, the dip tolerance and azimuth tolerance are interchangeable for a perfectly vertical variogram. 22.5° was used for both azimuth and dip tolerances in the vertical variogram, in addition to a bandwidth of 5 m so that only pairs from within a single drill hole are considered. The resulting vertical variogram for this oil sands deposit has a range of approximately 20 m.
Horizontal Variogram Parameter Selection
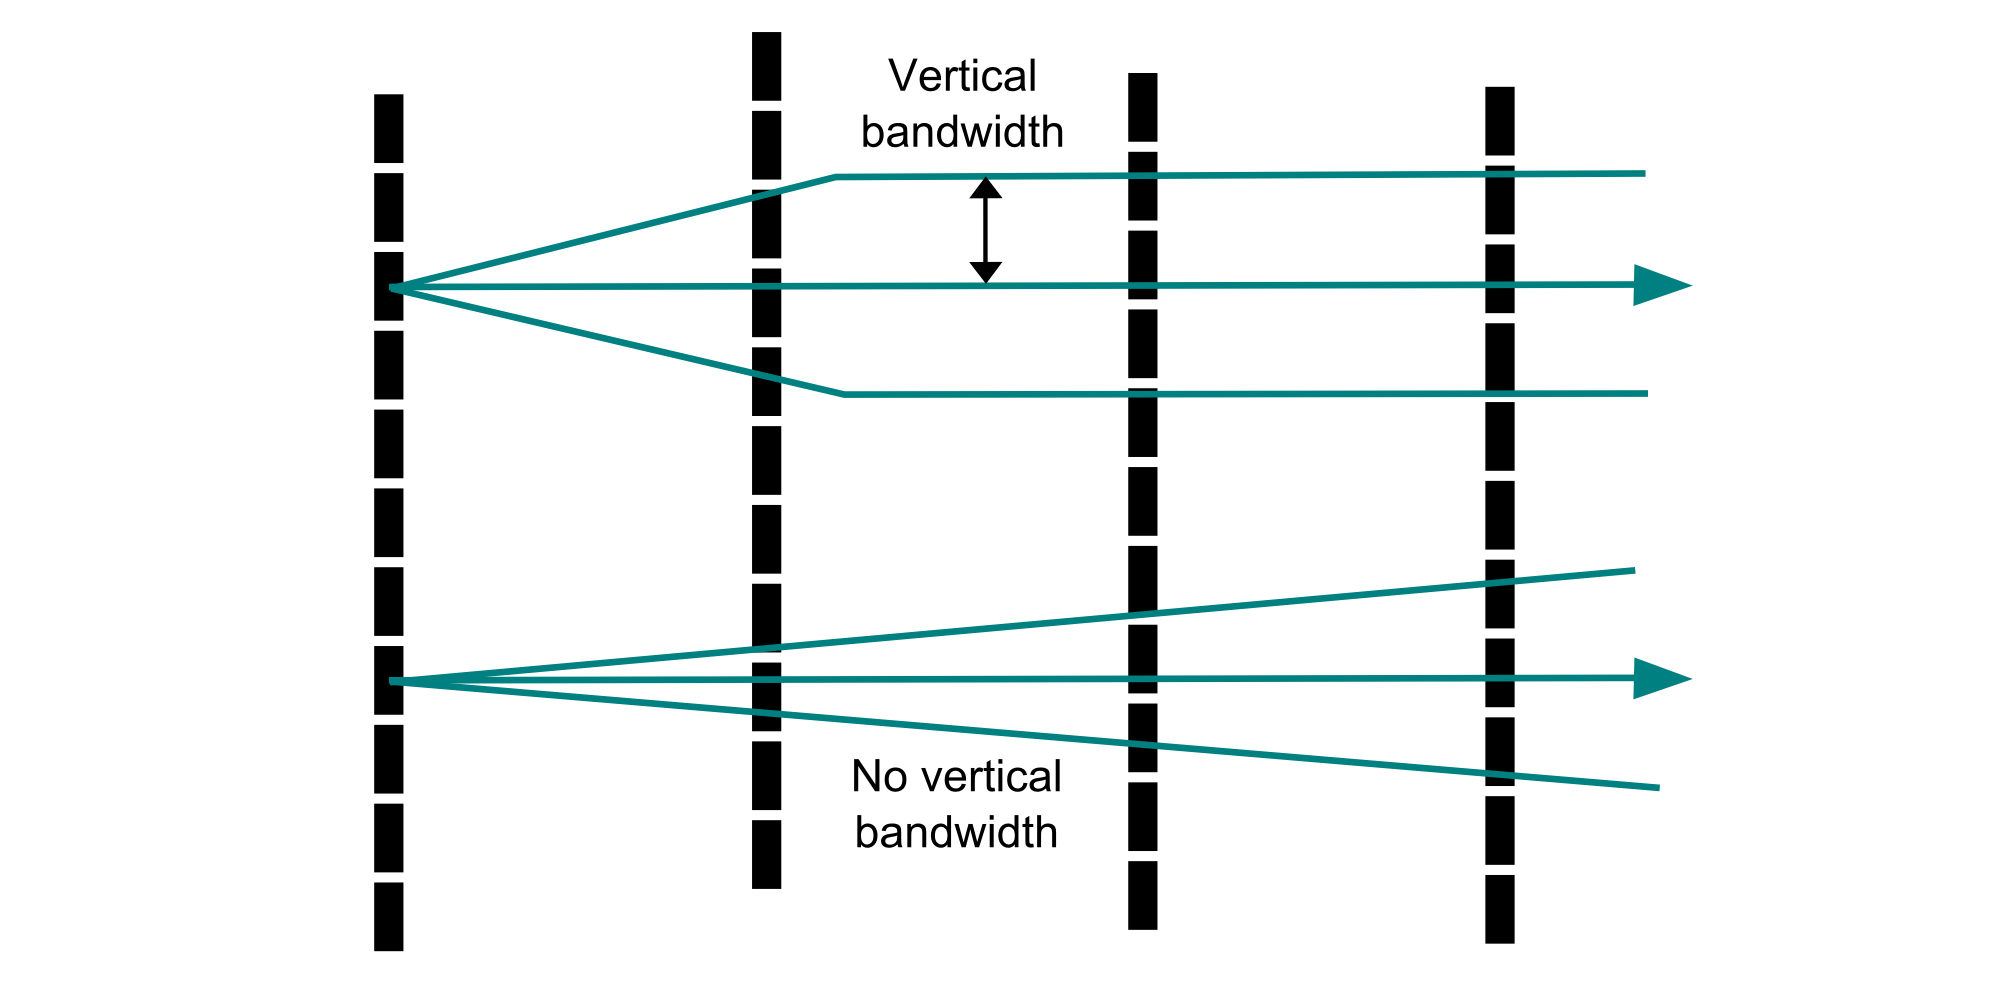
Within the transformed coordinates, horizontal directions and lag tolerances are selected using the standard criteria discussed in the variogram parameters lesson. For a stratigraphic deposit, the dip angle tolerance must typically be restricted to a very small value to avoid crossing stratigraphic units. Restricting the vertical bandwidth is also required. The degree to which the vertical tolerance should be restricted is indicated by the vertical variogram. In the oil sands deposit, the range of 20 m on the vertical variogram implies that a very narrow tolerance which pairs samples much less than 20 m apart should be used to limit unreasonable associations.
To achieve a balance between stability and precision, a dip angle tolerance and vertical bandwidth are combined. The stratigraphic nature of the deposit requires a limited vertical bandwidth to preserve horizontal structure in the experimental variogram. Using just a dip angle would result in an overly restrictive tolerance definition at short lags. For the oil sands deposit, a dip angle tolerance of 5° was used for the horizontal variograms. A vertical bandwidth of 5 m was further used to limit the amount of spatial variability introduced to the horizontal variograms from the use of a vertical tolerance.

Evaluation of Tabular Variograms
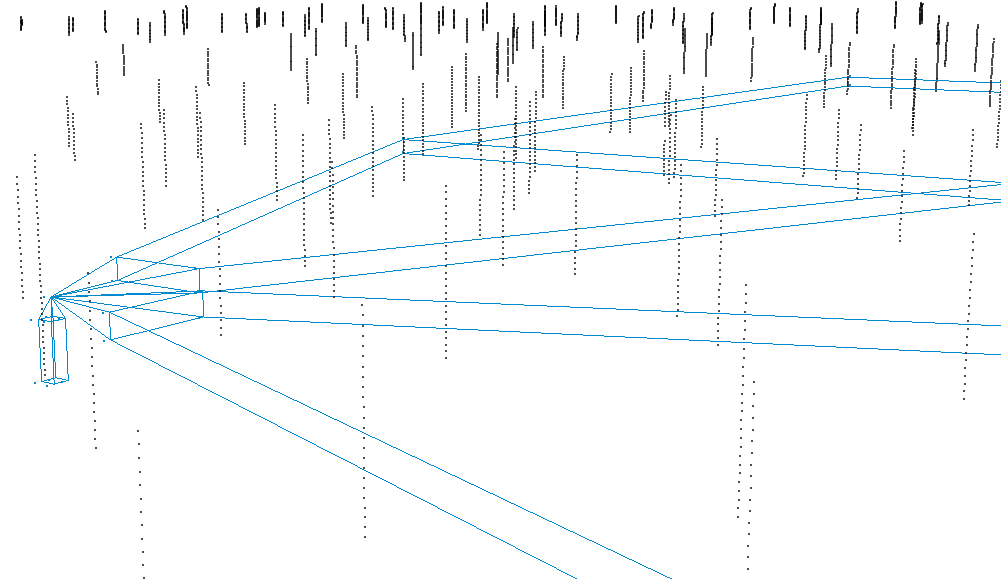
Combining all of the variogram tolerance criteria for the oil sands deposit, the tolerances are overlaid on an oblique view of the oil sands deposit. The substantial differences in scale are visible in the experimental variogram wireframes. Using these experimental variogram tolerances, directional variograms were calculated and plotted.


The calculated bitumen grade variograms are evaluated against the criteria established in the variogram tolerance parameters lesson (Deutsch, 2015). The variograms are not excessively noisy and could be reasonably modeled. There is substantial structure in the horizontal variograms which is consistent with our geologic interpretation of a stratigraphic environment. Similarly, the limited vertical continuity is consistent with a stratigraphic, layered depositional environment.
Summary
Tabular environments pose a challenge for experimental variogram calculation. Coordinates are typically transformed using a rotation and translation to align the structures with the principal directions. A stratigraphic transform may be applied for thickening and thinning stratabound environments. Folded and faulted environments require additional care for coordinate transformation.
Vertical and horizontal directions are typically well-defined in a tabular environment; horizontal directions are aligned with the plane of major continuity in the tabular deposit and the vertical direction is perpendicular. The limited vertical continuity in a tabular environment requires a restrictive vertical tolerance. Typically a dip tolerance and vertical bandwidth are required for a structured, stable horizontal variogram. The final variograms should be evaluated to ensure that they are not excessively noisy, there is reasonable structure and the variograms align with the geologic interpretation of the deposit.