Cite this lesson as: Camana, F.A. & Deutsch, C.V. (2019). The Nugget Effect. In J.L. Deutsch (Ed.), Geostatistics Lessons. Retrieved from http://geostatisticslessons.com/lessons/nuggeteffect
The Nugget Effect
Fernando Camana
University of Alberta
Clayton V. Deutsch
University of Alberta
October 1, 2019
Learning Objectives
- Understand the nugget effect and improve its definition.
- Analyze the parameters that affect the estimation of nugget effect.
- Explain the behavior of the nugget effect in others supports or variables.
- Understand the techniques when implemented on real data (source code available).
Introduction
The nugget effect is a phenomenon present in many regionalized variables and represents short scale randomness or noise in the regionalized variable. It can be seen graphically in the variogram plot as a discontinuity at the origin of the function (Morgan, 2011). The value of the nugget effect is the intercept of the variogram function at a lag distance of almost zero; because at a lag distance of zero, the variogram has a value of zero.
The nugget effect is affected by the volume of sampling, decreasing in value as the volume increases. The use of different drilling diameters or sample lengths for the same project complicates matters. Also, all errors in the measurement and variations in the orientation of drilling and sampling affect the variability and nugget effect (Carrasco, 2010). Compositing to reasonable support is recommended in most cases. Ensuring an appropriate QA/QC procedures and careful consideration of different data types is always recommended.
Theory
A variogram model is required as kriging and Gaussian simulation methods require a valid model of spatial variability for all distances (Deutsch, 2015), and the nugget effect is an essential part of the model.
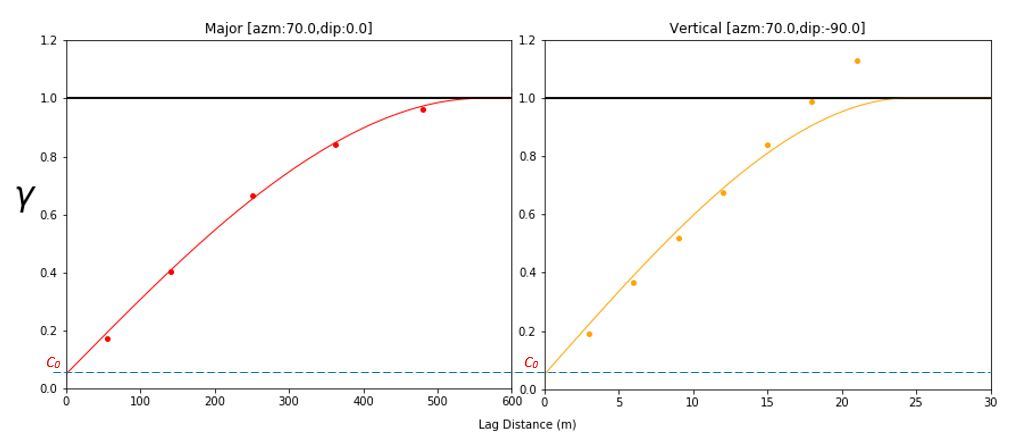
The nugget effect (\(c_0\)) in the variogram model is a constant value for all distances greater than zero and could be estimated by extrapolating the variogram to an intercept on the variogram axis. The chosen nugget effect must permit the variogram model to be fit in all directions, as shown in the figure below. The red and blue variograms are in two principal directions with very different length scales, but the same nugget constant.
Nugget effect as part of the LMR
The Linear Model of Regionalization (LMR) is universally used for fitting experimental variograms with a valid model. The LMR considers the regionalized variable (\(Z({\mathbf{u}})\))to be a sum of the expected value of this regionalized variable (\(m({\mathbf{u}})\)) plus a set of normalized and independent factors (\(Y_i\)) that have unique spatial variability (Wackernagel, 2003), that is, their own orientation of anisotropy, length scales and variogram shape:
\[Z({\mathbf{u}}) = \ m({\mathbf{u}})+ \sum_{i=0}^{nst} a_i.Y_i({\mathbf{u}})\]
The nst+1 standard regionalized factors are independent. The \(0th\) factor, by convention, has no spatial correlation and is referred to as the nugget effect. The variogram of the regionalized variable is expressed as a sum of the variograms of the regionalized factors:
\[\gamma_z({\mathbf{h}}) = \sum_{i=0}^{nst} c_i. \Gamma_i({\mathbf{h}})\]
The experimental variograms in all directions plus general geological understanding are used to choose the number of structures, specify the standardized variograms \(\Gamma_i({\mathbf{h}}), i=1,\ldots,nst\) and the variance contributions \(c_i=a_i^2, i=1,\ldots,nst\). The contribution of the \(i=0\) random factor or structure is the nugget effect.
The nugget effect \(c_0\) is a constant and applies in all directions. An apparently anisotropic nugget effect would be modeled with an additional structure with reasonable small ranges in all directions.
Sample Length
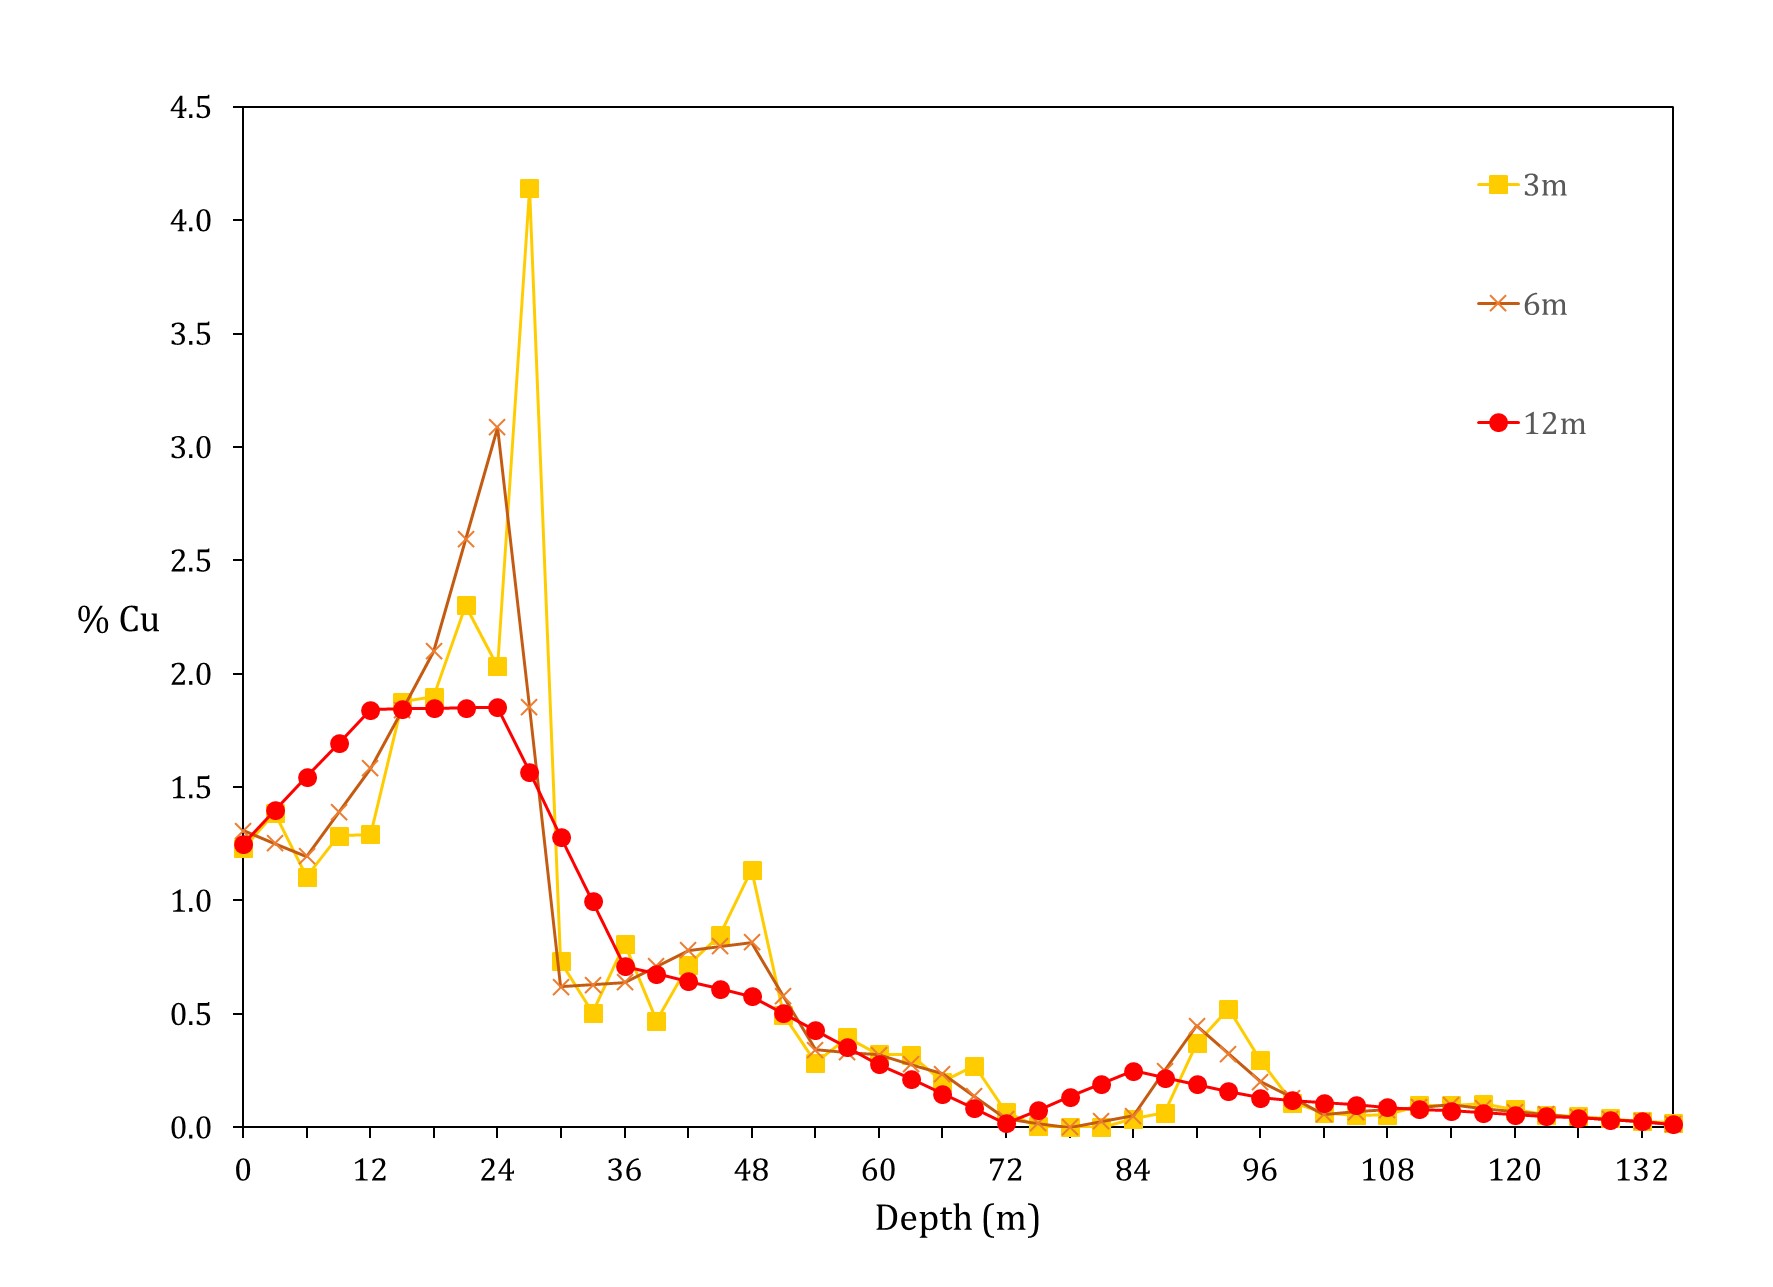
The sample length affects the values and variability; the plot below shows how the variability of values reduces when the support increases. The variance for composites of 6 and 12 m reduce by 32% and 58%, respect to the 3 m samples.
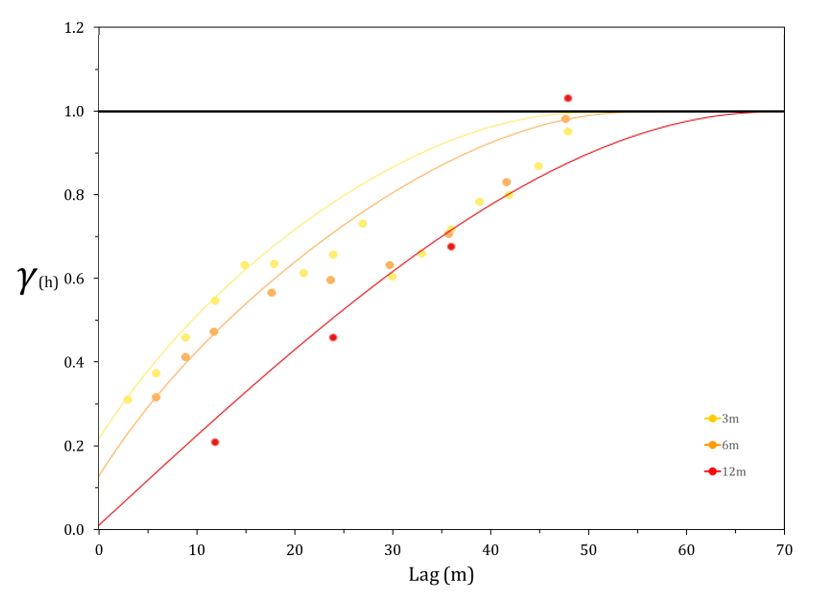
In the same way, the variogram plot shows how the support affects the average variability and short scale behavior. The nugget effect reduces with increasing support. Note that these variograms have all been standardized to a sill of one, which is consistent with common practice.
Sample orientation
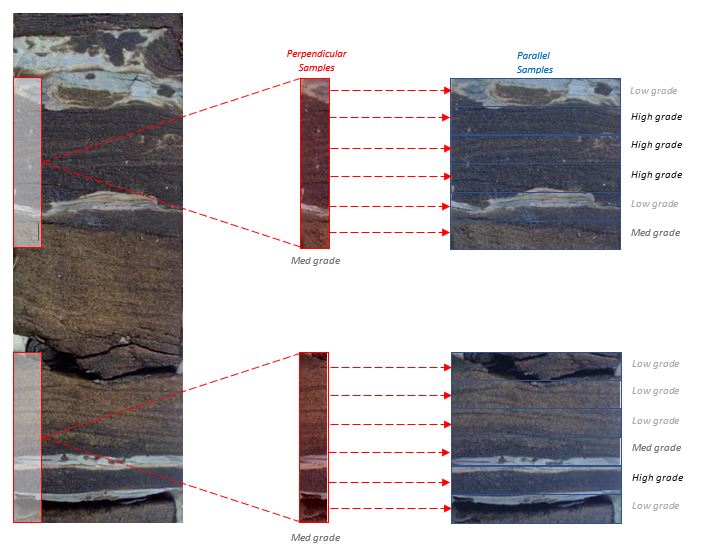
Consider a core sample from a vertical drill hole, which crosses different sedimentary sand layers where the darker ones are the high grades, and the lighter ones are the low grade. The size of both samples, red and blue, are the same but with a different orientation, perpendicular to the sand layers and parallel, respectively. The perpendicular samples contain a mixture of different types of sand and grades. This variability would be averaged out, and the values would be very similar. The parallel sampling does not mix the high and low values to the same extent, even there could be samples in entirely high or low grade layers. Thus, the variance of the parallel or horizontal samples is higher than the perpendicular samples. Although the geology is the same and the sample size the same, the nugget effect and entire variogram could change with sample orientation.
Directional variograms
The variogram in the directions of greatest continuity may not be the best way to calculate the nugget effect, because the samples are often separated by large distances. Drilling is often perpendicular to the plane of greatest continuity and more widely spaced in the directions understood to be more continuous. The downhole variogram considers pairs of samples along the drill direction, which allows evaluates consecutive samples separated by short distances.
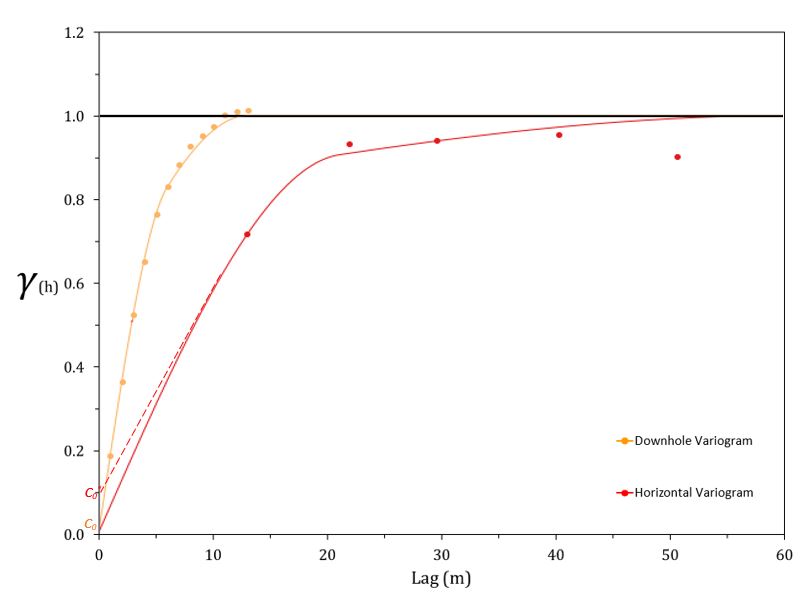
The plot shows two variograms, the red one corresponds to the variogram in the direction of greatest continuity, with samples separated approximately 20 meters. The red dotted line indicates the possible nugget effect for this variogram (\(c_0^*\)). The orange line corresponds to the downhole variogram, with samples separated by 1 meter. This indicates a lower nugget effect (\(c_0\)) than the other directional variogram. The nugget effect of the downhole variogram provides a value that can be used in all directions.
Additional considerations
There are some aspects to consider in the estimation of the nugget effect. First, a consistent drilling diameter and orientation will make the nugget effect more predictable. The length for the base sampling should be short and standardized to permit appropriate compositing, which must be chosen based on geological and engineering considerations. Systematic quality control on all the mechanical and chemical processes involved will help ensure consistent samples (Carrasco, 2010). Finally, a single low nugget constant must be chosen to fit all directional variograms.
The nugget effect estimated from blast holes or production sampling is different from that estimated with exploration drill holes, due to the differences in drilling and sampling. The blast holes have larger support than exploration drill holes. The larger support would lead to a lower nugget effect; however, the sampling procedures are often less stringent due to the nature of blast hole drilling and the large number of samples to process. Therefore, the nugget effect could be larger or smaller. Data of significantly different support and sampling procedures may need to be considered in a cokriging framework where the differences are accounted for explicitly.
In the case of categorical variables, there should be no nugget effect if the categorical variable has a continuity larger than the composite length. If there is an apparent nugget effect for a categorical variable, then the categorical variable may be mixed at a small scale and would be better treated as a continuous proportion.
Smoothing
A nugget effect indicates that the regionalized variable has short scale variability that is random and unpredictable. A higher nugget effect in kriging will lead to smoother estimates. This may seem counter intuitive since a nugget effect means more variability; however, that variability is at a short scale and is unpredictable with any practical data spacing. Equivalent results are obtained in simulation: simulated realizations at a point scale will show more short scale variability when a nugget effect is present. Then, when the point scale values are averaged to blocks, the results will become smoother. The greater smoothing associated to a higher nugget effect is realistic and correct.
Conclusions
The nugget effect is made up of two components, the first one and the most important is related to the intrinsic randomness of the regionalized variable. The second one is related to the sampling process, including drilling orientation, sampling support and assays errors.
The main role of the nugget effect is to fit the variogram model in all directions, although an incorrect choice could have serious implications. It has been observed that for a high nugget effect the kriging estimates will become overly smoothed, which can carry to financial losses by Ore misclassification. Similarly, should the nugget-effect be under-estimated, the kriging estimates will be overly selective, resulting in ore blocks incorrectly sent to the waste dump and waste blocks sent to the process plant (Morgan, 2011).
The support strongly influences the calculation of the nugget effect, because depending on the sampling length, the randomness can be attenuated or increased. In addition, unlike other parameters like orientation, the support can be modified easily by compositing. The orientation is another important parameter that influences the values of the distribution and the nugget effect.
The nugget effect could be estimated from directional variograms with the highest sampling density, although they may not coincide with the greatest direction of continuity. The downhole variogram may provide a high number of consecutive samples, useful for estimating the nugget effect.